


Click here for the Audio Version
Financial Markets- Stocks
The stock market as a whole is up about 6% over the past month with the Dow topping out at over 34,000 in the middle of August before drifting back down to just over 33,000. The stock market is responding to the better than expected job reports indicating that the US economy may not be in a recession. Traditional standards considered a recession of 2 straight quarters of declining GDP which is what we currently have. That said, I am not sure we have ever had 2 straight quarters of declining GDP with unemployment rates as low as they are right now. The national unemployment rate as of July is around 3.5%. Personally, I have no idea if this is a recession all I know is inflation needs to be wrangled in.
Financial Markets- Bonds (Mortgage Rates)
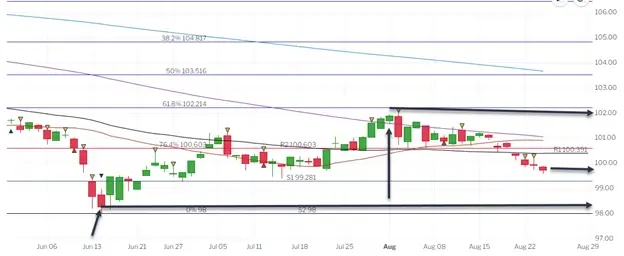
After a nice rally in the bond market at the start of August, all of the gains have nearly been given back, and mortgage rates are almost back to their highest levels in over a decade. As a refresher course on the illustration below, it is an illustration of the Fannie Mae 3.5 coupon. As the price goes up, mortgage interest rates to the customer goes down and vice versa. Around the middle of June is where mortgage rates were at its absolute highest and the price of this mortgage-backed security was at its lowest (pricing out at a little over 98).
By the beginning of August, the price of the bond reached nearly 102, which is equivalent to a nearly .5% improvement to mortgage rates and we thought we might be headed towards seeing 30-year fixed mortgage in the 4’s again. However, the rally didn’t last long. Inflation reports continued to come in hot and a better than expected jobs report added fuel to inflation concerns. In real time, we are probably about .25% higher than we were at the beginning of August, and .25% lower than where we were in June when rates peaked.
Southern Nevada Real Estate
August home sales for Southern Nevada saw activity and values slide month over month. The Median sales price of single-family residences drifted down to $465,000 from just over $480,000 in June, but still up nearly 15% from July 2021. June marks the end of nearly 10 years of uninterrupted home value appreciation. 2,066 single family residence homes exchanged hands last month, down from nearly 2700 in June and down from nearly 3,300 sales in July of 2021. With over 7,000 homes available on the market this translates into over 3 months of housing supply and accelerating into a buyer’s market. (General consensus considers 6 months’ supply a buyer’s market).
The million-dollar question is what are values going to do over the next year to 18 months? While no one has a crystal ball we can draw conclusions by looking at the past. Now, what year we set the time machine to make comparisons to the current real estate market will have a significant impact on making predictions.
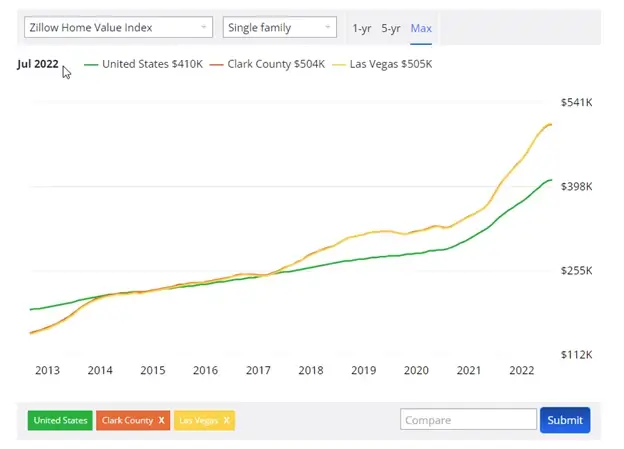
As an example, if we set the time machine back to 2007, where the median price of a home was $325,000 and compare it to today’s median priced home of $465,000 the conclusion would be that home value appreciation over the past 15 years has been modest. Roughly 45% increase over 15 years is just 3% per year. That is nearly ½ the historical home value appreciation rate in the US. If we set the time machine back to 2013, where home values were significantly undervalued the conclusion would be that Vegas would be due for a massive correction.
The median priced home in 2013 was $140,000. Compared to today’s $465,000, we are talking about 232% home value appreciation in just 9 years, or 26% a year. That’s just bananas! We know 2007 values did not make sense as much as 2013 home values did not make sense. So where should we set the time machine back to?? I like to set mine back to 2000, about the time I moved to Las Vegas, before the housing market sky-rocketed and crashed and sky-rocketed again.
In 2000, the median priced home went for about $185,000. Compared to today’s median sales price of $465,000 we are looking at 150% appreciation over 22 years or roughly 7% a year in home value appreciation. The average nationwide home value appreciation rate for the past 22 years is around 5%.
I will finish with this. In 2000 the median priced home nationwide was in line with the median priced home in Las Vegas. Las Vegas has been one of the fastest growing cities in the US for the past 20 years. My conclusion is that 7% a year appreciation is not that out of line and in-short I do not see anything like the correction we saw from 2008 to 2012 on the horizon. It’s possible we correct some while rates stay elevated but if rates drop back into the 4’s I think we can see those losses gain back quickly. Vegas real estate has a tendency to overcorrect so it wouldn’t shock me to see a decline in values, but I do think the decline is temporary and shallow.
By partnering with me you and your entire client database can be enrolled in List Reports and Home Bot. Rate Plug will help you provide customized financing packages for your listings so you can advertise payment. (Below are links if you are unfamiliar with these tools)
https://welcome.listreports.com/
Look for me in in Rate Plug so you can offer customized loan estimates through the MLS